Analytic View
Analytic view shows up all the usecase cards deployed for the selected customer in the deployed usecase section on the top as shown in the below image.
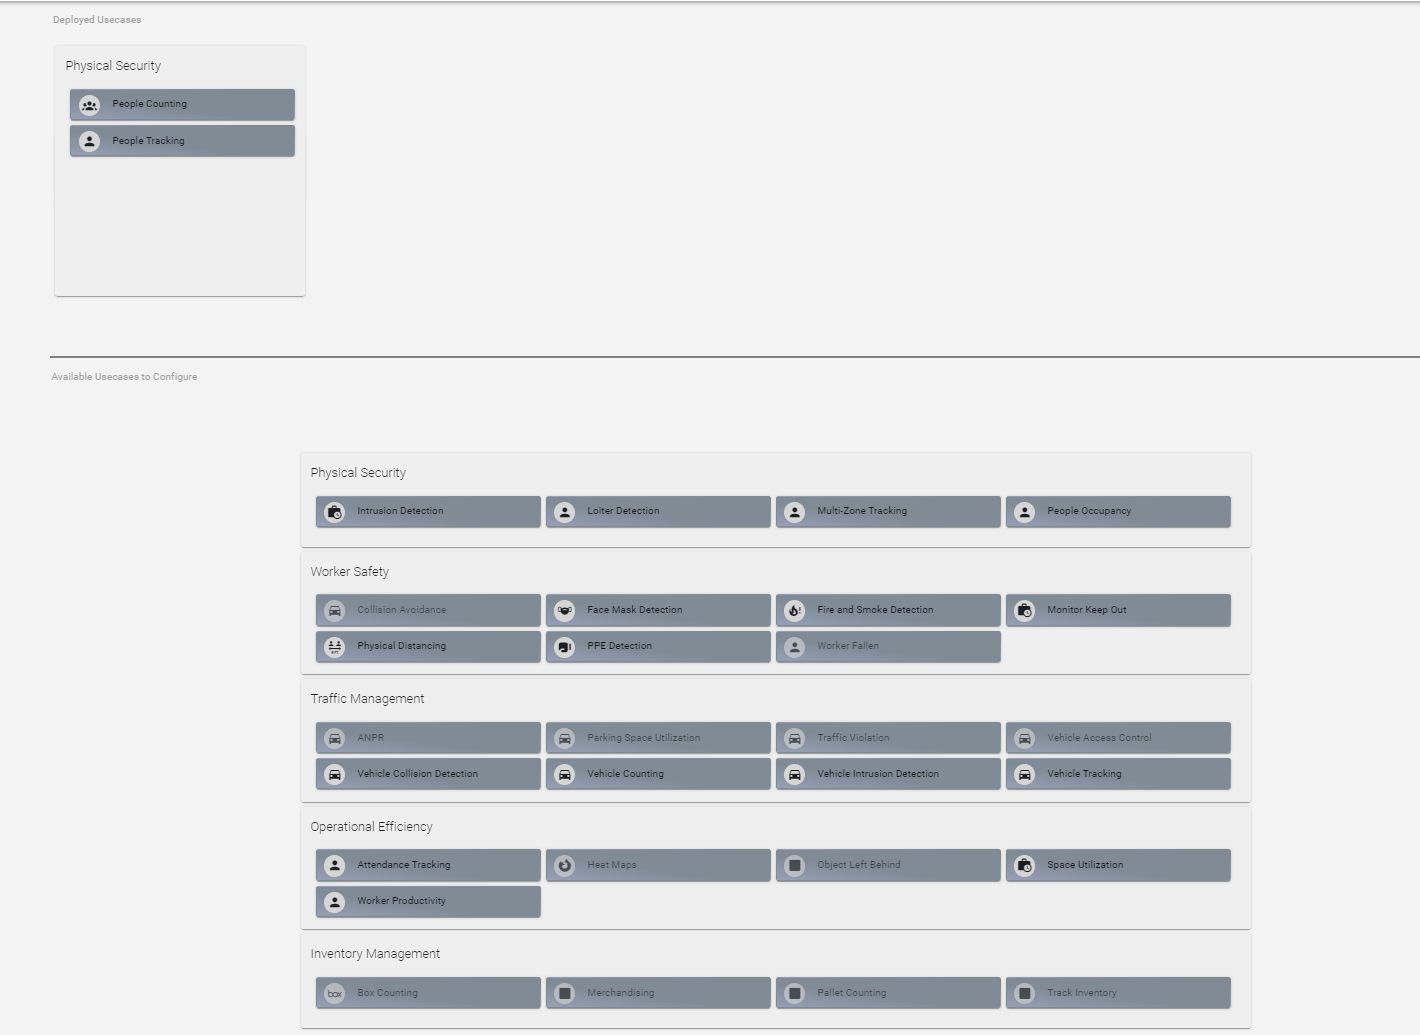
This page also displays Available Usecases to Configure in the below section which includes all other usecases that can be configured by the user in the Megh portal.
This list is bundled into 5 usecase bundles i.e
Physical Security,
Worker Safety,
Traffic Management,
Operational Efficiency,
Inventory Management
each of these bundle contains list of similar type of usecases.
The different usecases which are not available for deployment will be shown but will be disabled and user cannot select those usecases.
The user can click on the deployed Usecase cards which displays the analytic view of list of channels configured for the selected usecase. The below image shows the channel list page.
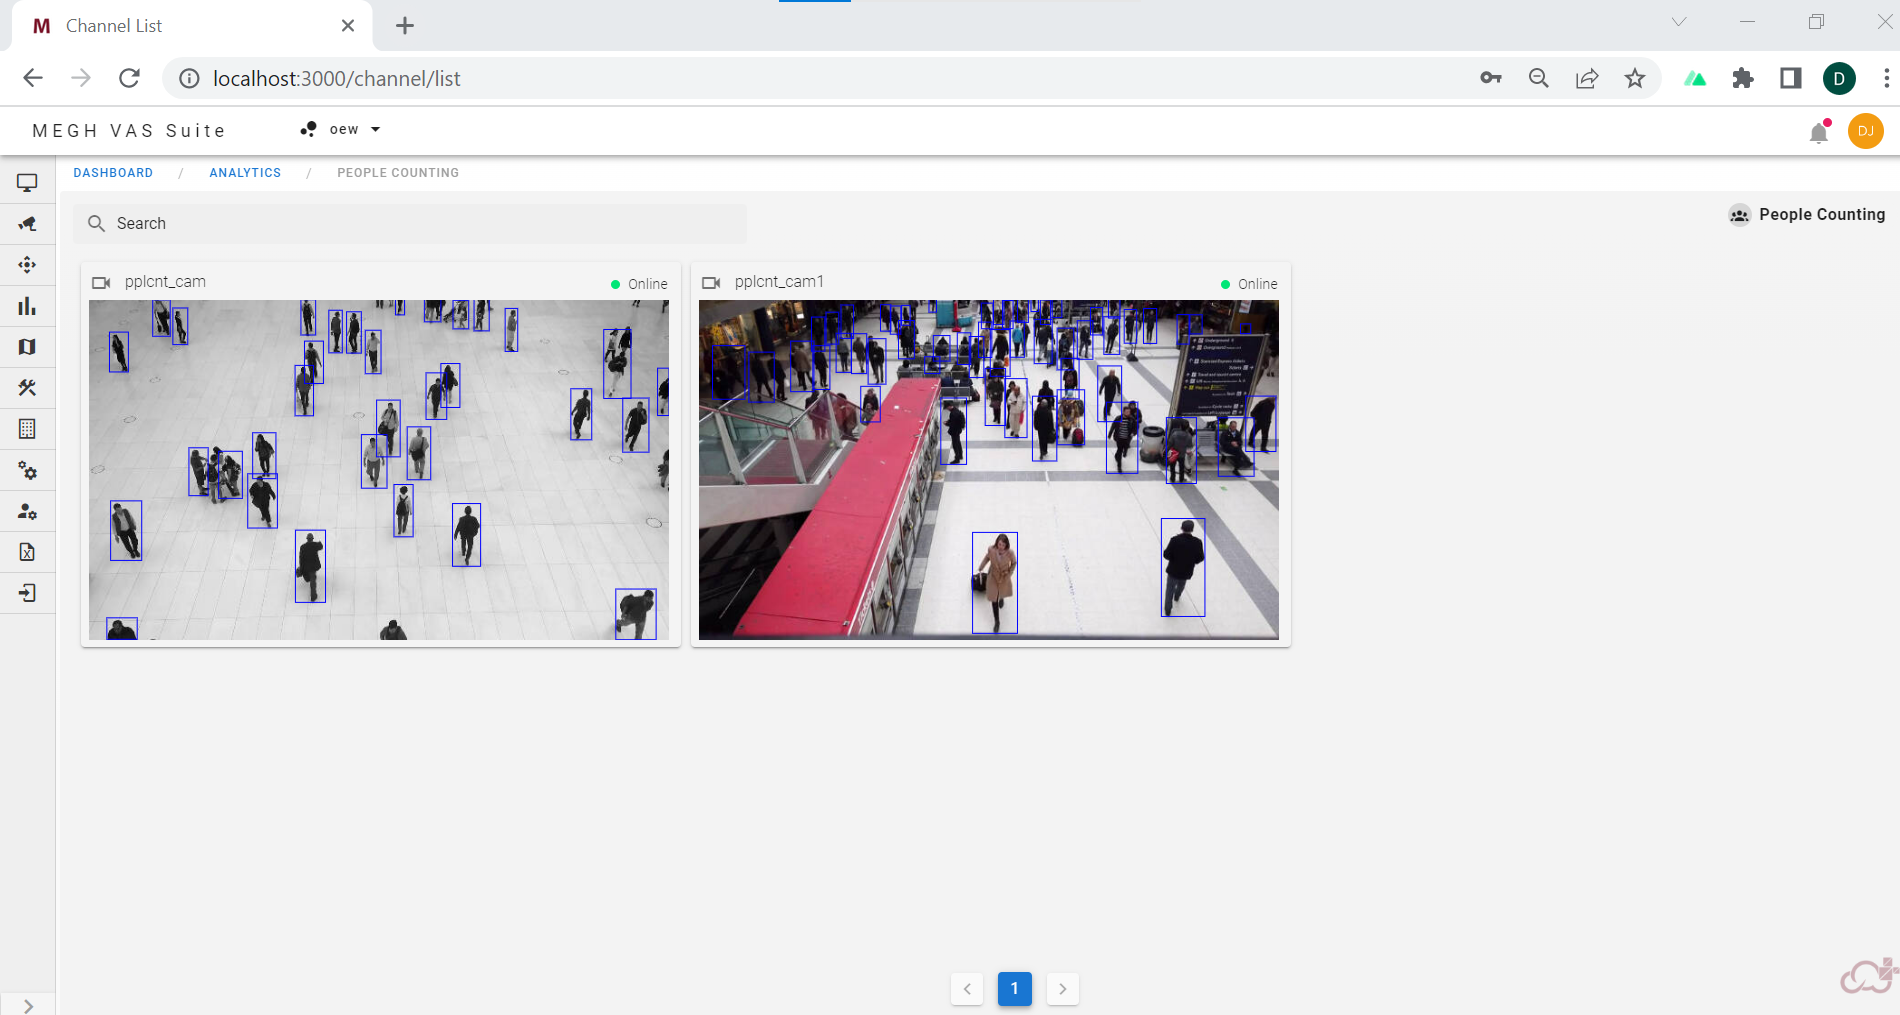
The above page also shows different options like Search to search for channels and pagination to navigate when there are multiple channels. Here the user can see the video streaming in the channels for that particular use case.
Add Analytics
To get the Analytic view as shown in above section, first the user must have done the addition of analytics. Each device with the source video must have analytics attached to it. Once the device is created the next step is addition of analytics.
In the device view page, user can see the channel with the source video playing for the created device as shown below.
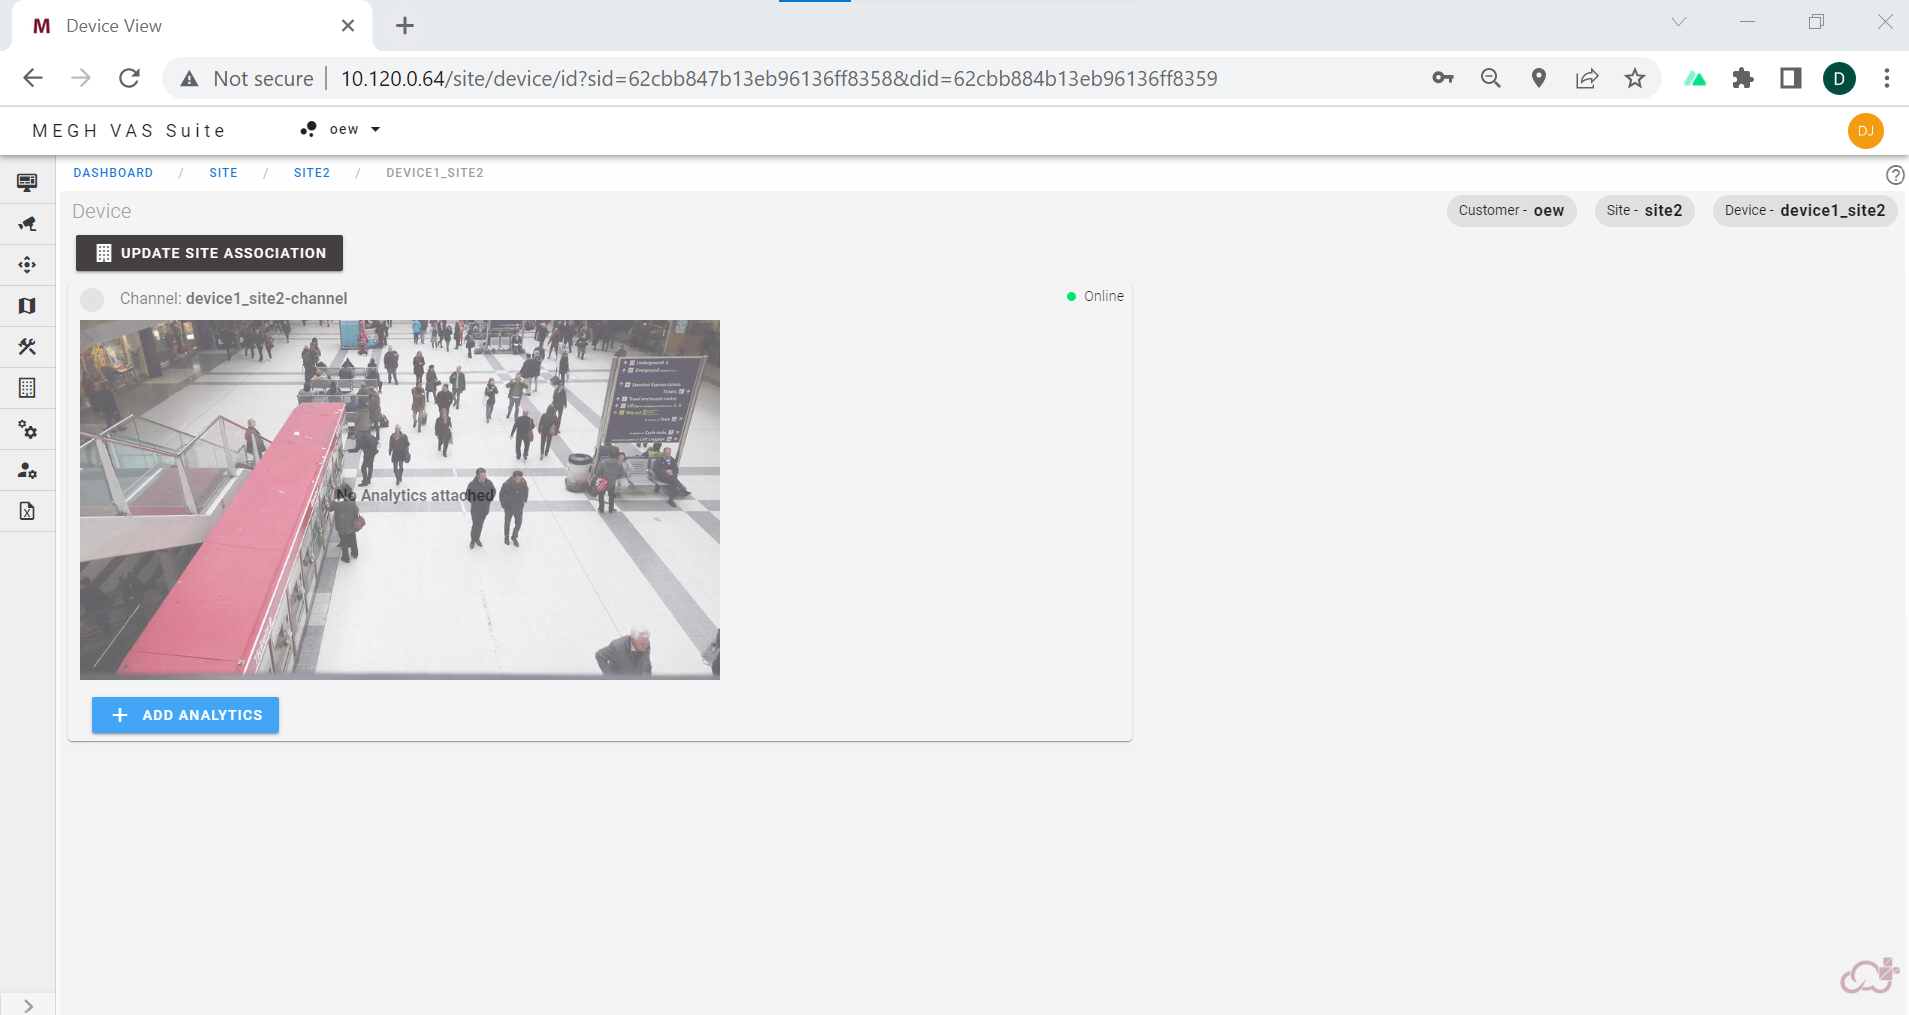
Here the user can click on add analytics button present in the bottom of the channel to add analytics which opens up a add analytics pop up page as shown below.
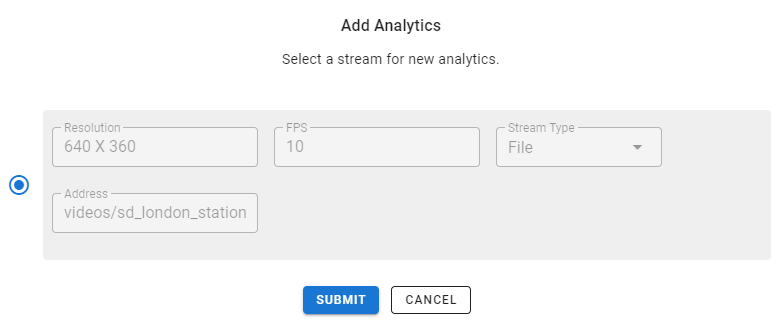
Here the details regarding the source video like the resolution, FPS, stream type and source address are autofilled from the device form, user can review it and click on submit. This opens up a channel add page as shown below.
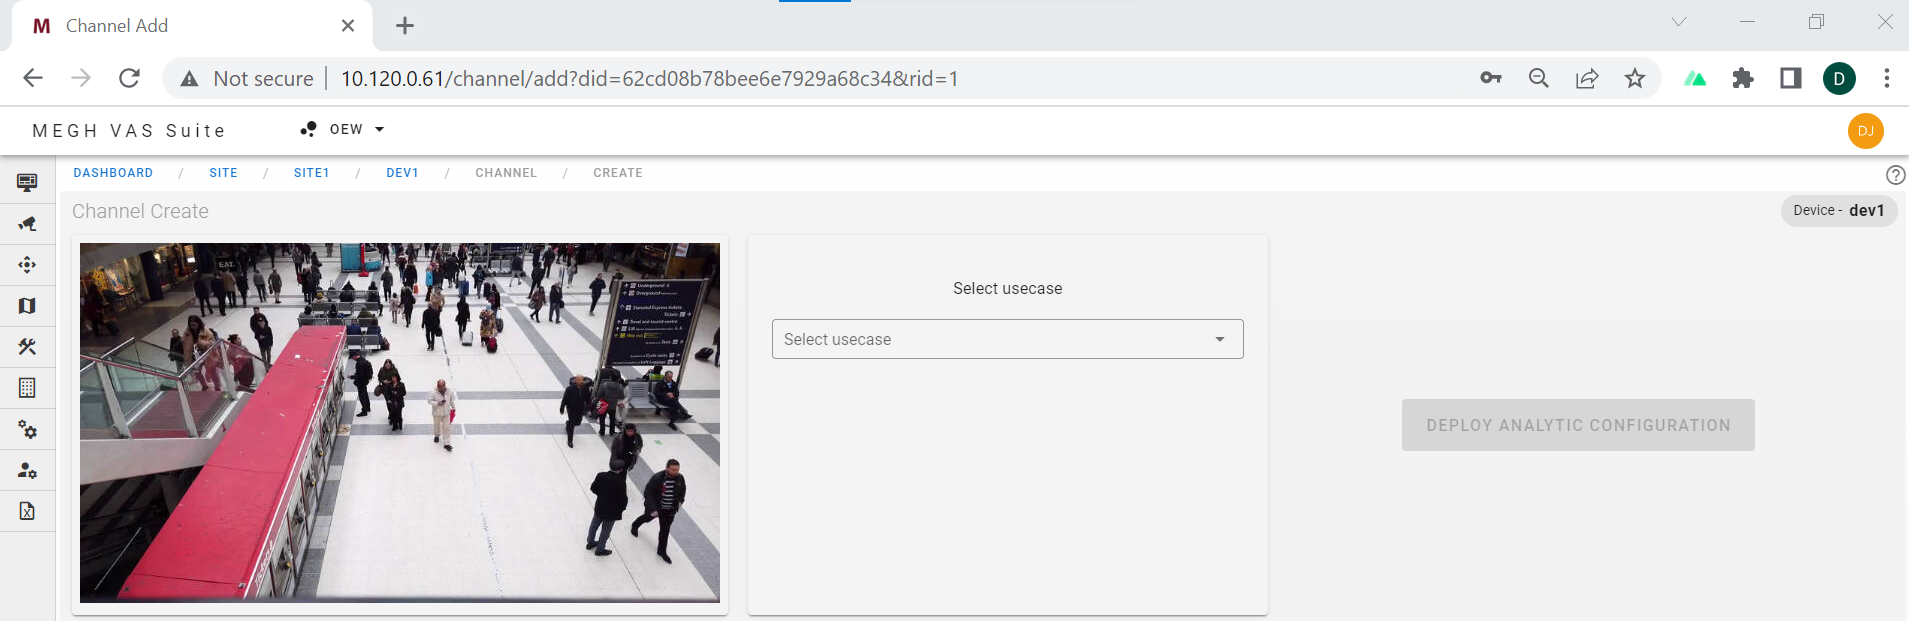
Here first user must add the usecase from the drop down menu which is shown as below.
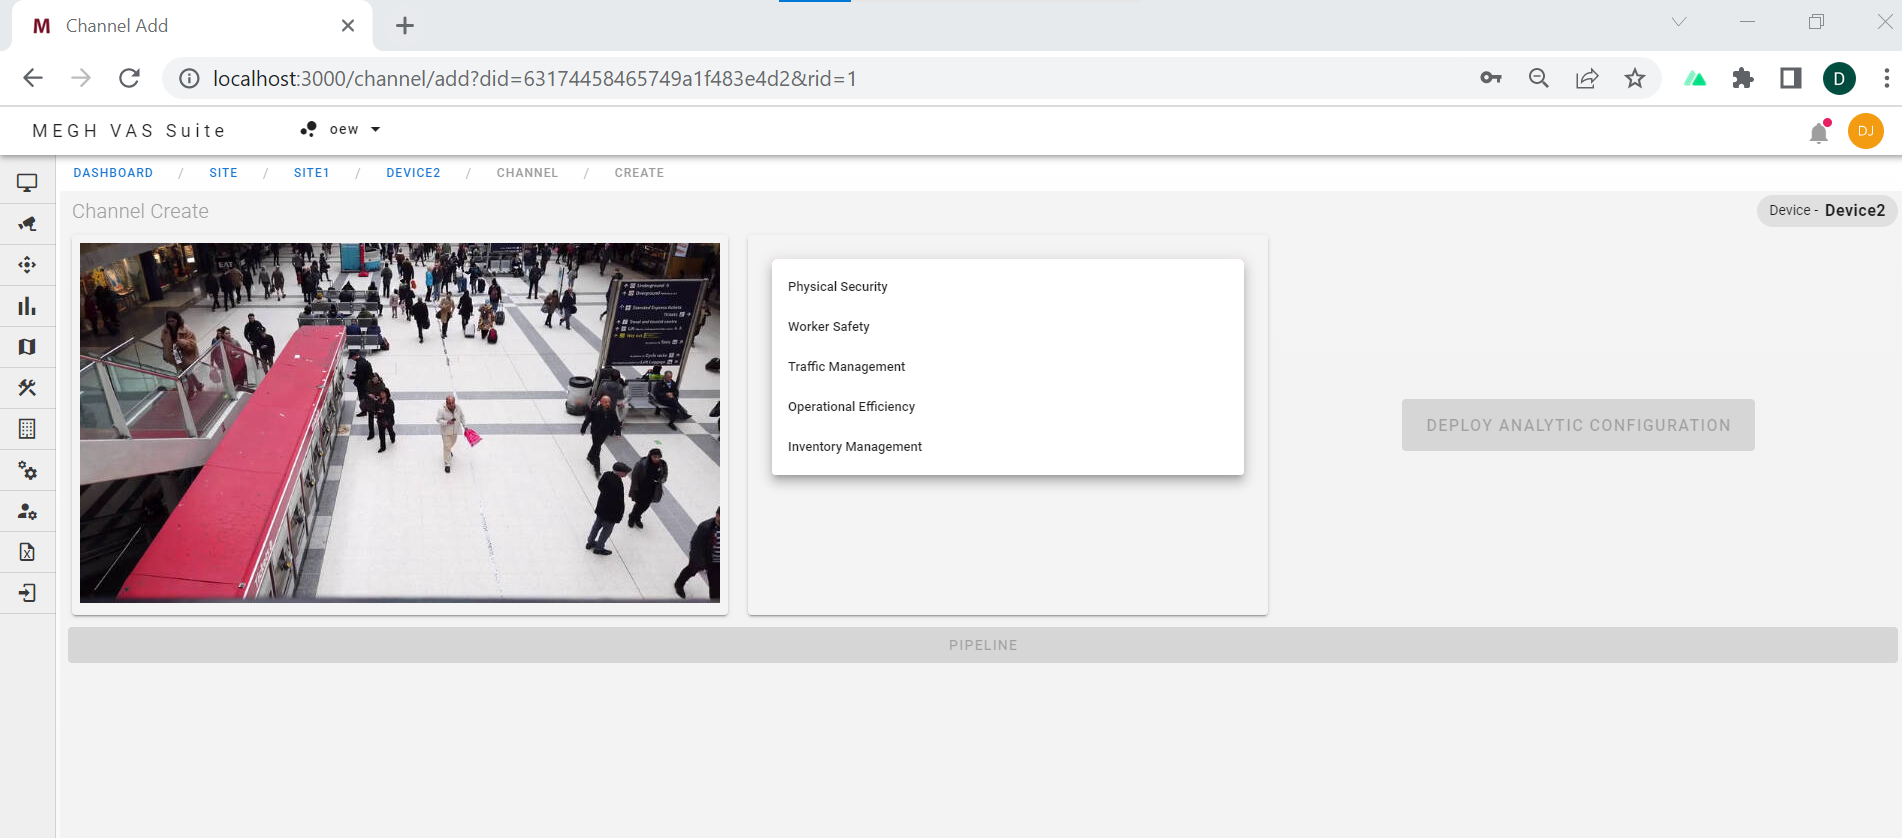
The above image list the usecase bundle namely Physical Security, Worker Safety, Traffic Management, Operational Efficiency, Inventory Management, when the userclick on any of these it opens up a new dialogue box containing list of similar usecases as shown in the below image.
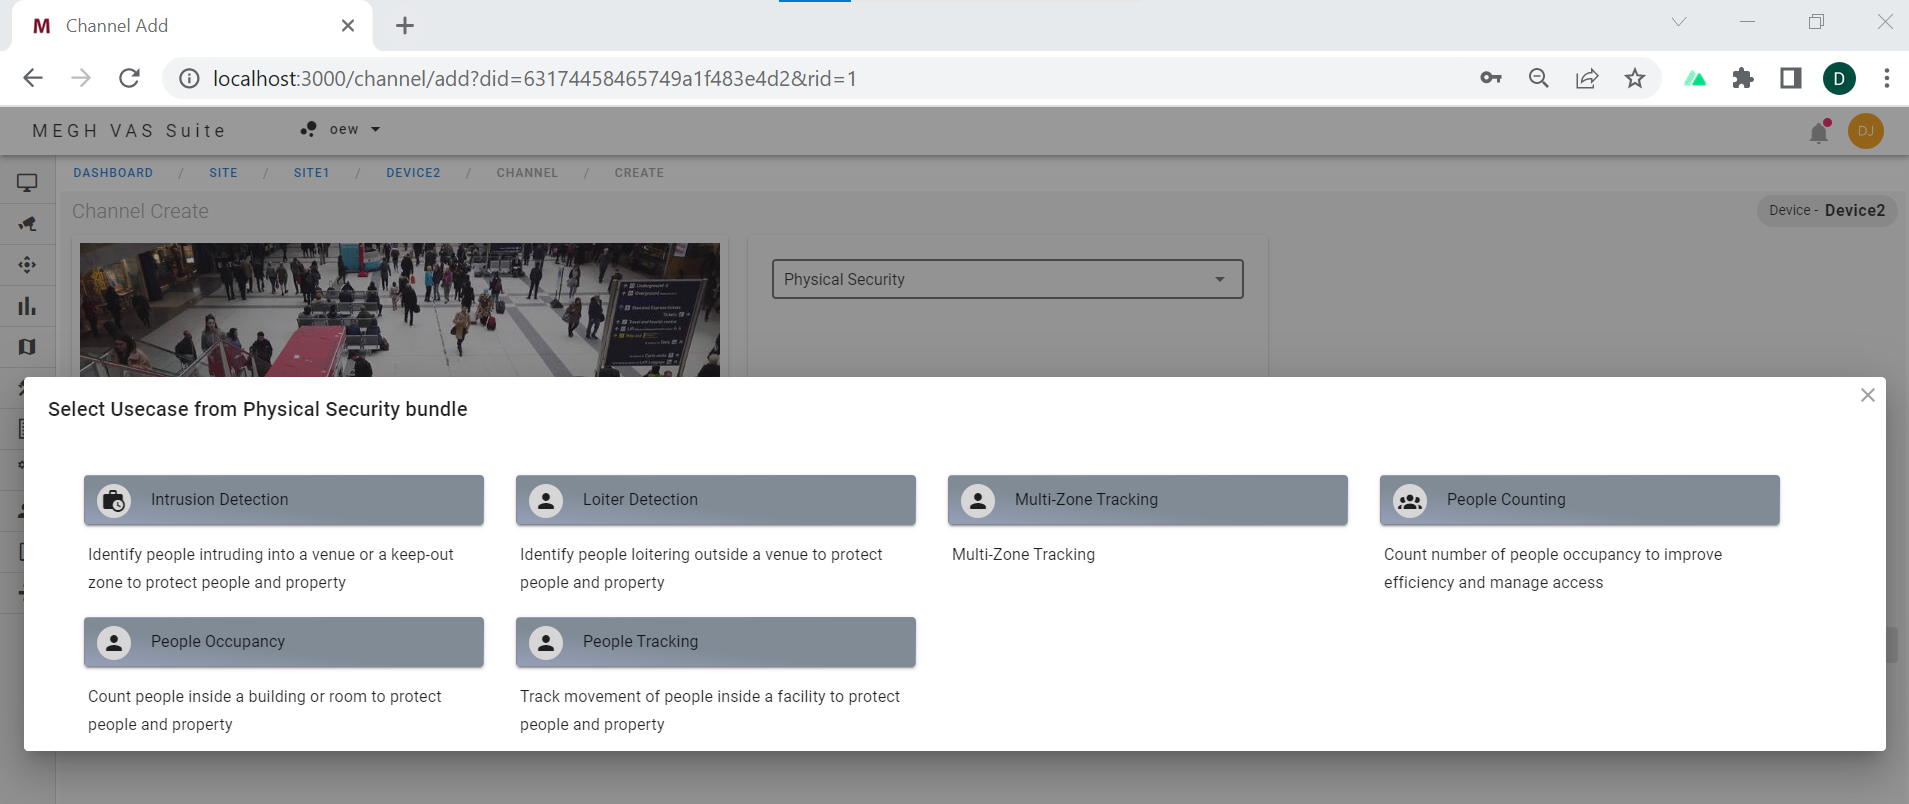
Here the user can click on any of the usecase for the channel and then the user must come down and add the pipeline for the usecase selected as shown below.
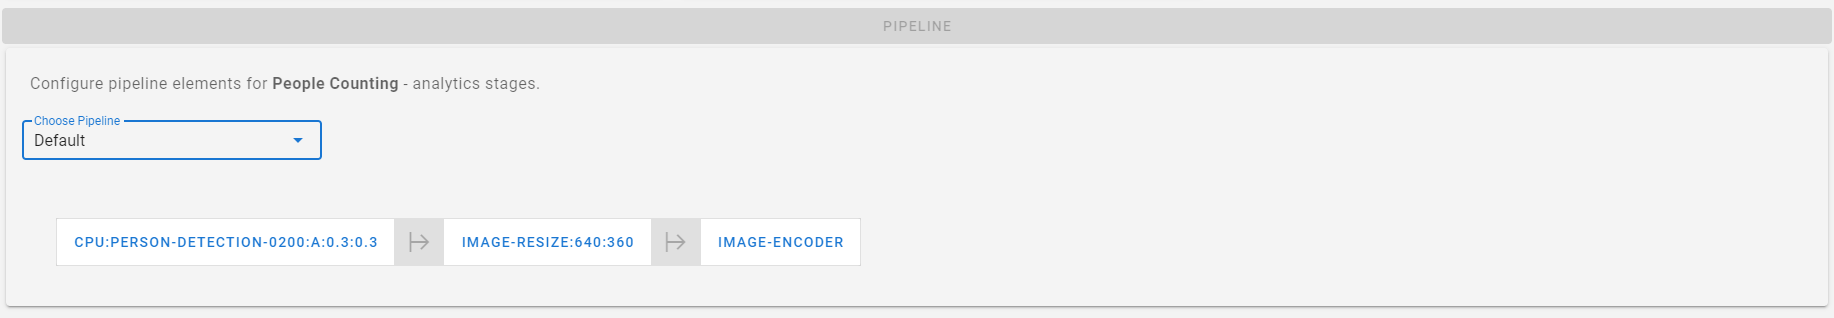
The user must select the pipeline from the drop down menu which shows up the pipeline where user can edit the pipeline element by clicking on it which opens up configurations dialogue box as shown below.
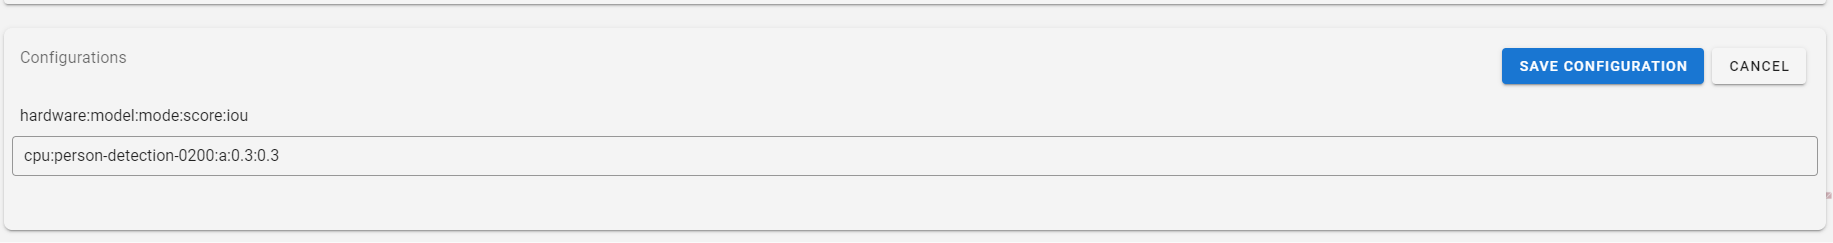
Here the user can edit the pipeline element and click on save configuration.
The below image shows the usecase and pipeline selected by the user with deploy analytic configuration enabled.
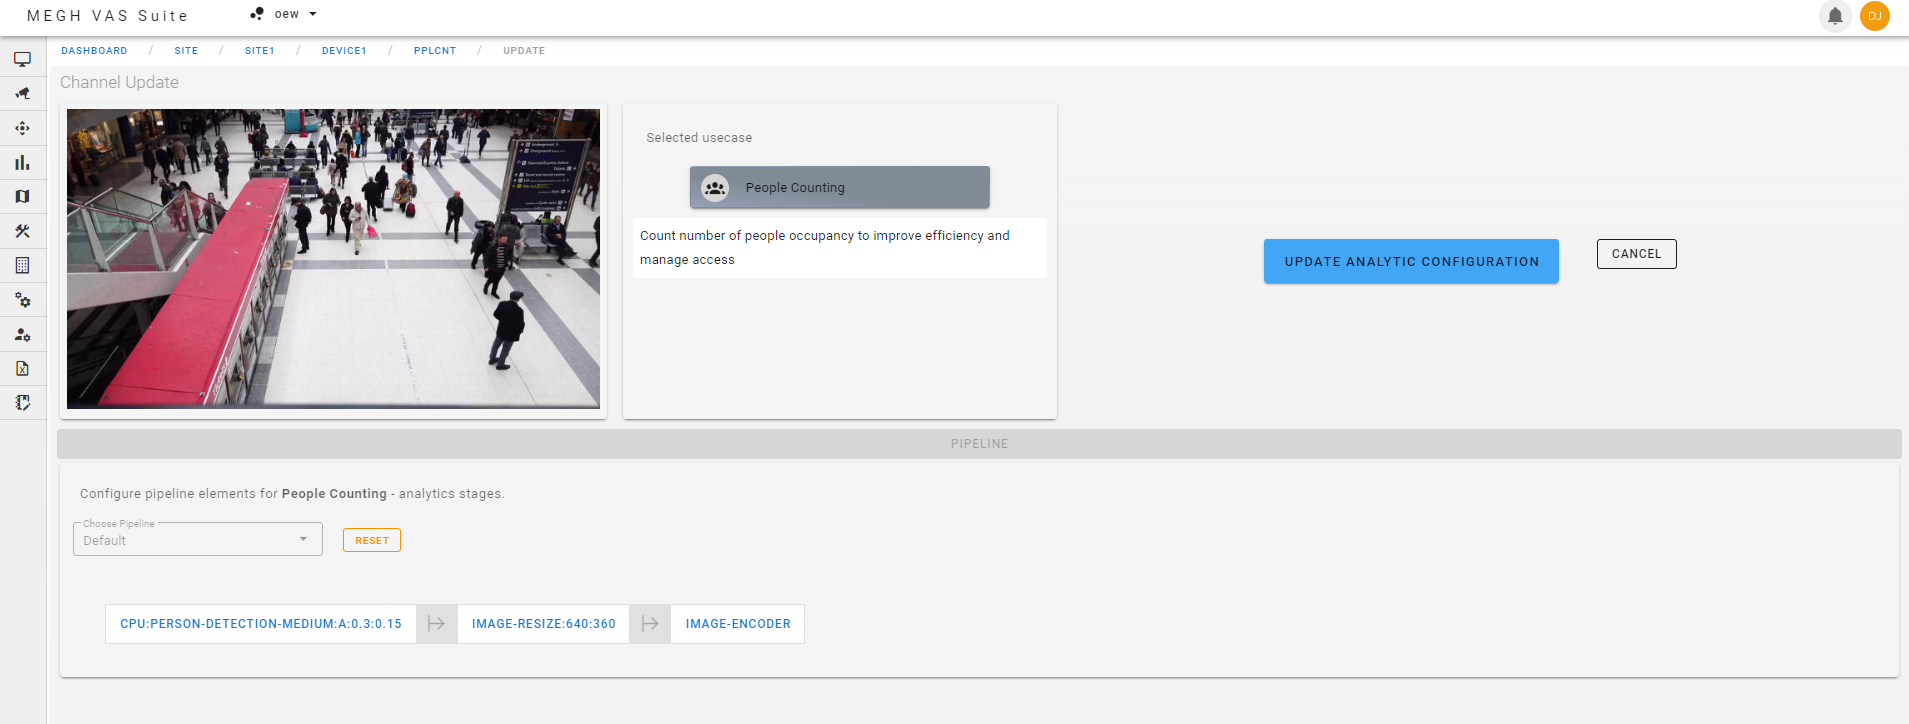
Once all the usecase and pipeline is set the user can click on the deploy analytic configuration button which opens up an assign analytics pop up page as shown below.
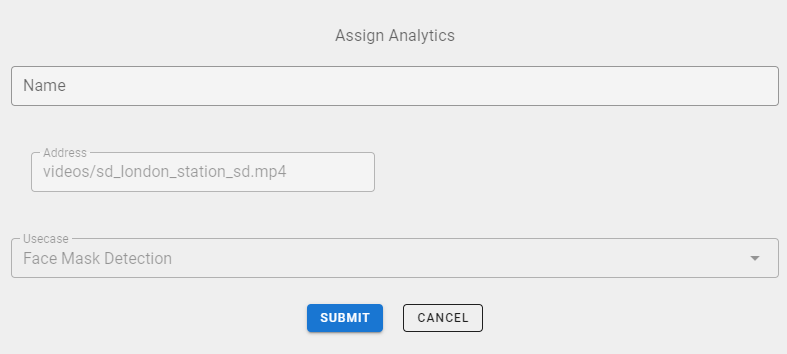
Here the user must enter the channel name and click on submit. Once the user clicks submit, the channel will be created with the selected analytics and the user will be redirected to channel page as shown below.
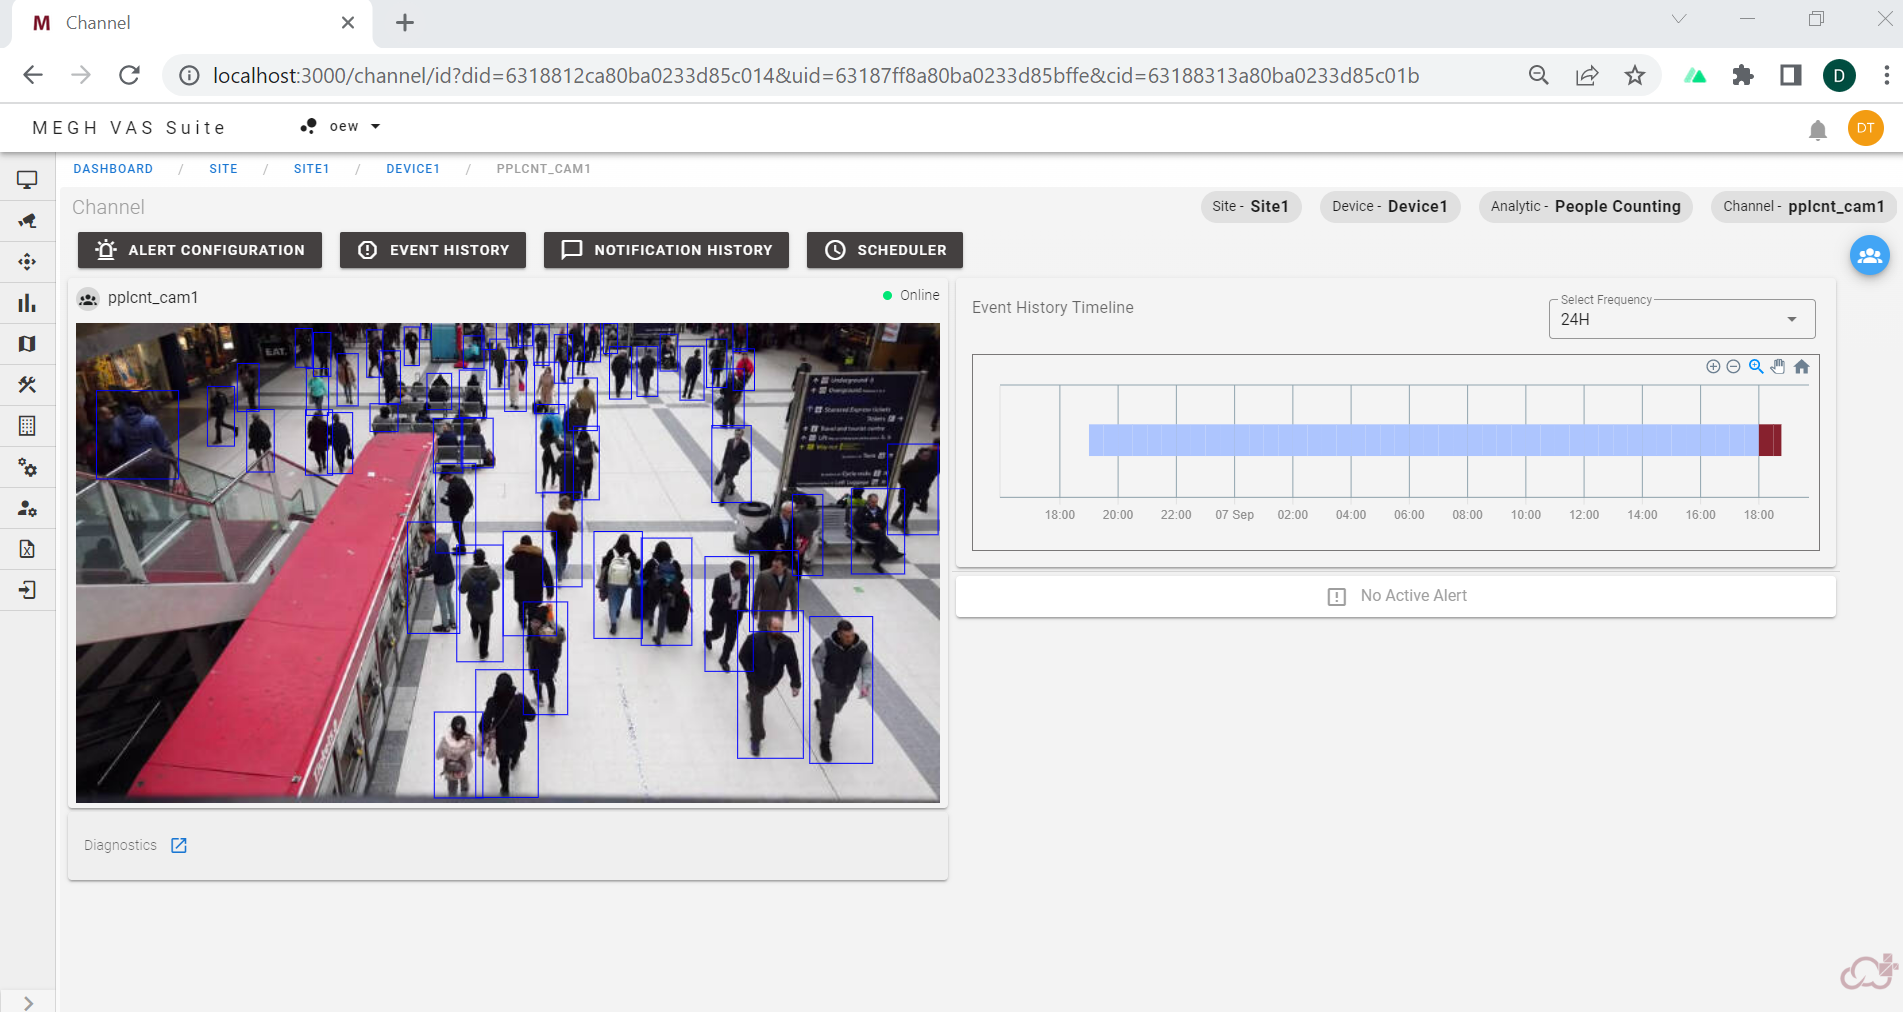
Here the user can see the video streaming in the channel for the selected use case. The status of the video being streamed or not in the User interface is indicated using Online (in green color) and offline (in red color) on top right corner of each channel.
This page also displays the Event history timeline graph and also details of active alert condition set for that channel below it.
The channel Page also displays the Site Name, Device Name, Analytic or usecase name, Channel Name on the top right corner.
It also has a bell icon on the top right which is the notification bell. This will be highlighted with red dot whenever there is a notification in the channels as shown below.
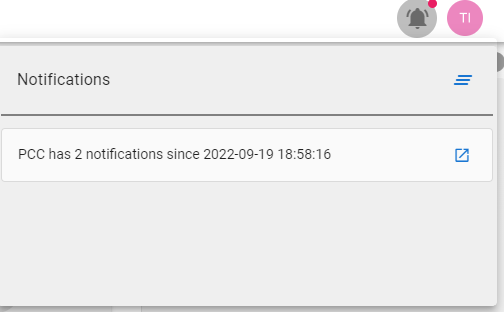
Here the user is displayed with number of notifications with date and time for each of the channels in the portal.
The user can click on blue arrow to go to the repective notification page to visualize the alert notifications. The user is also notified with other details like storage deletion process and channel health notifications in the popup.
The user can edit and delete the Analytic in the Channel page by clicking on the blue icon on the top right which when clicked on shows two buttons as follows.

The user can click on pen icon to edit the analytics for the channel which opens up a dialogue box as follows.
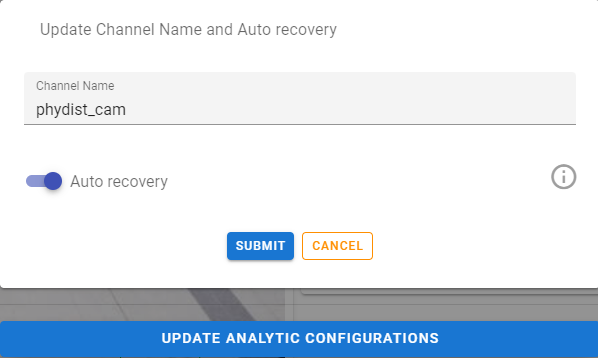
Here the user can edit the channel name and enable or disable the auto recovery option and also update the analytic configuration set for the channel.
auto recovery: if it is enabled, the camera+analytic recovery will take place automatically. This option must be disabled before deleting the analytics for the channel.
The bin icon is for deleting the analytics attached to the channel.
There are 4 buttons provided in the channel page namely:
Alert Configuration
Event History
Notification History
Scheduler
Click on the above respective links to get more info.
If the user clicks on blue arrow in the diagnostic view card, the user will be directed to the diagnostic page which is shown in the below page:
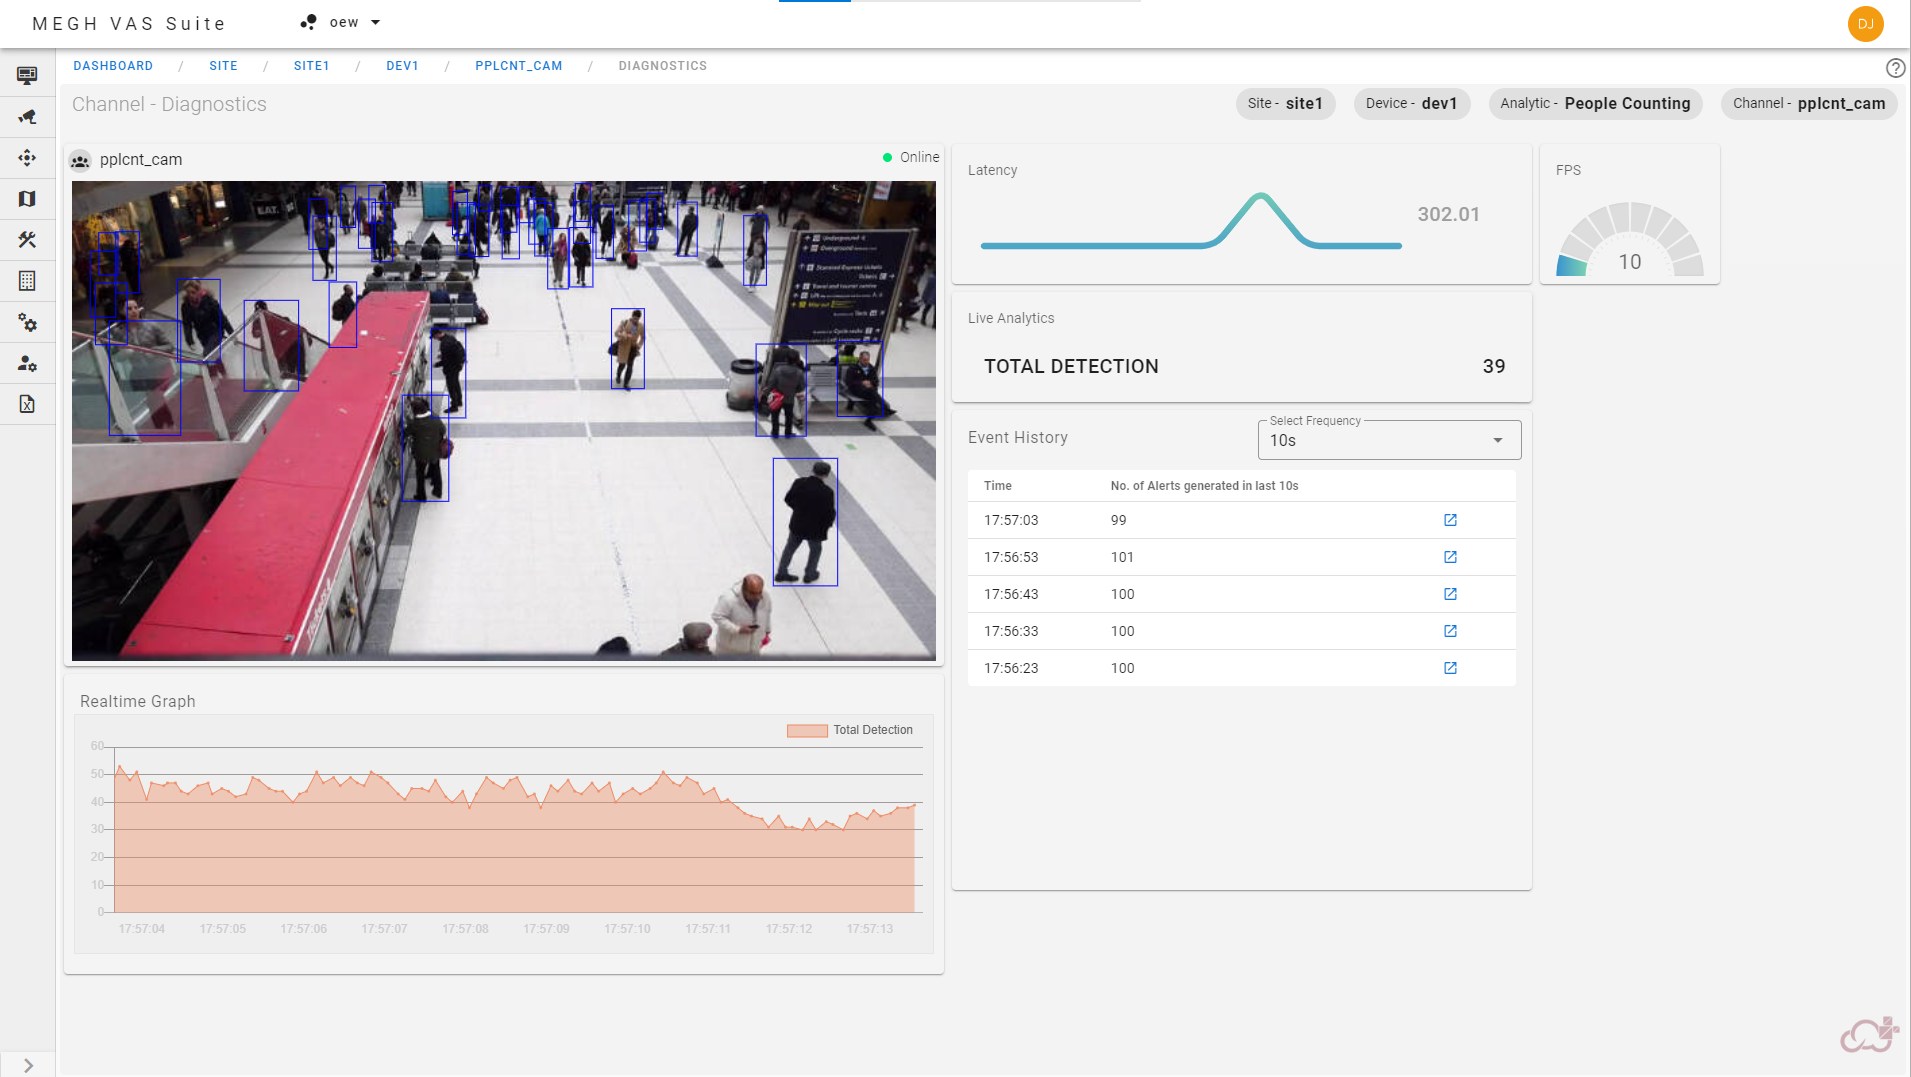
This page gives a diagnostic view for the channel created by displaying various features like:
- Real time graph
- Live events in event history card
- Live analytics card containing analytic detection for the channel
- Latency
- FPS